Know where your retirement stands — and what would move it
Open WealthPath and the first thing you see should answer the only question that really matters: am I going to be okay? The redesigned Mission Control dashboard leads with that verdict — and lets you change it in real time.
The dashboard opens with a verdict: one readiness score, the four numbers behind it, and where each one leads.
The wall of cards problem
Most planning tools — ours included, until now — greet you with a grid of equal-weight cards. Retirement age here, a portfolio chart there, savings rate, a runway figure, an asset-allocation donut, and a what-if panel folded away at the bottom. Everything is present, but nothing is foreground. The one thing you came to find out — are you on track? — has to compete with a dozen other numbers for your attention. So you squint, you scroll, you do the arithmetic in your head, and you leave a little less sure than you'd like.
The deeper miss is that a dashboard like that is read-only. It tells you where you are, but not what it would take to change it. The most natural next thought — what if I retired two years earlier? what if I saved another $300 a month? — sends you off to a separate screen, if it's answerable at all.
A dashboard that opens with the answer
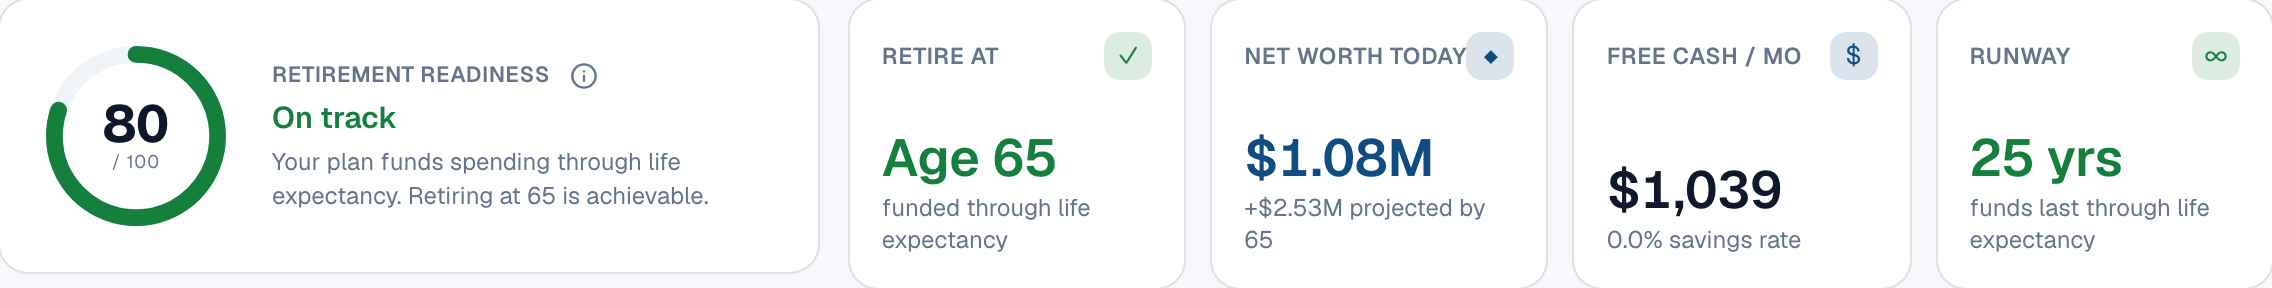
Mission Control flips the order. The retirement-readiness score is the hero: a single number from 0 to 100, colour-banded and captioned in plain language — "On track. Your plan funds spending through life expectancy. Retiring at 65 is achievable." No interpretation required.
One number, and the four that justify it
Beside the gauge sit the four figures that explain the verdict, each a doorway to the detail behind it:
- Retire at — your target age and whether it's funded.
- Net worth today — what you're worth now, and what that grows to by retirement (here, $1.08M → +$2.53M projected by 65).
- Free cash / mo — what's left over each month after tax, expenses, and debt, with your savings rate.
- Runway — how long the money lasts, and whether it lasts for life.
They never disagree with the gauge. If your plan technically scores well but the money runs short late in life, the verdict won't claim "On track" — it steps down to "Tight," so the headline, the colour, and the tiles always tell one honest story.
The live "What if…"
This is the part that changes how the dashboard feels. A slim What if… bar sits right under the verdict with three levers — retire at, extra savings per month, and retirement spending.

Three levers. Drag one and the entire dashboard recomputes from the real projection engine.
Drag a lever and the whole page responds at once — the gauge re-scores, the verdict rewrites, every tile updates, the chart redraws, the milestones shift, the metrics recompute. And it isn't a back-of-the-envelope estimate: each tug re-runs the same projection engine that produces your actual plan, accounting for tax, government benefits, contribution room, and your real withdrawal order. A scenario badge appears so you always know you're looking at a hypothetical, and Reset to plan snaps everything back.
See the cost, not just the score
Numbers tell you whether; the chart tells you by how much. The lifetime portfolio scrubber stacks your investable accounts by type and lets you scrub year by year from today through life expectancy. The moment you open a scenario, a dashed "current plan" line is laid over the live bars — so the trade-off is drawn, not described.
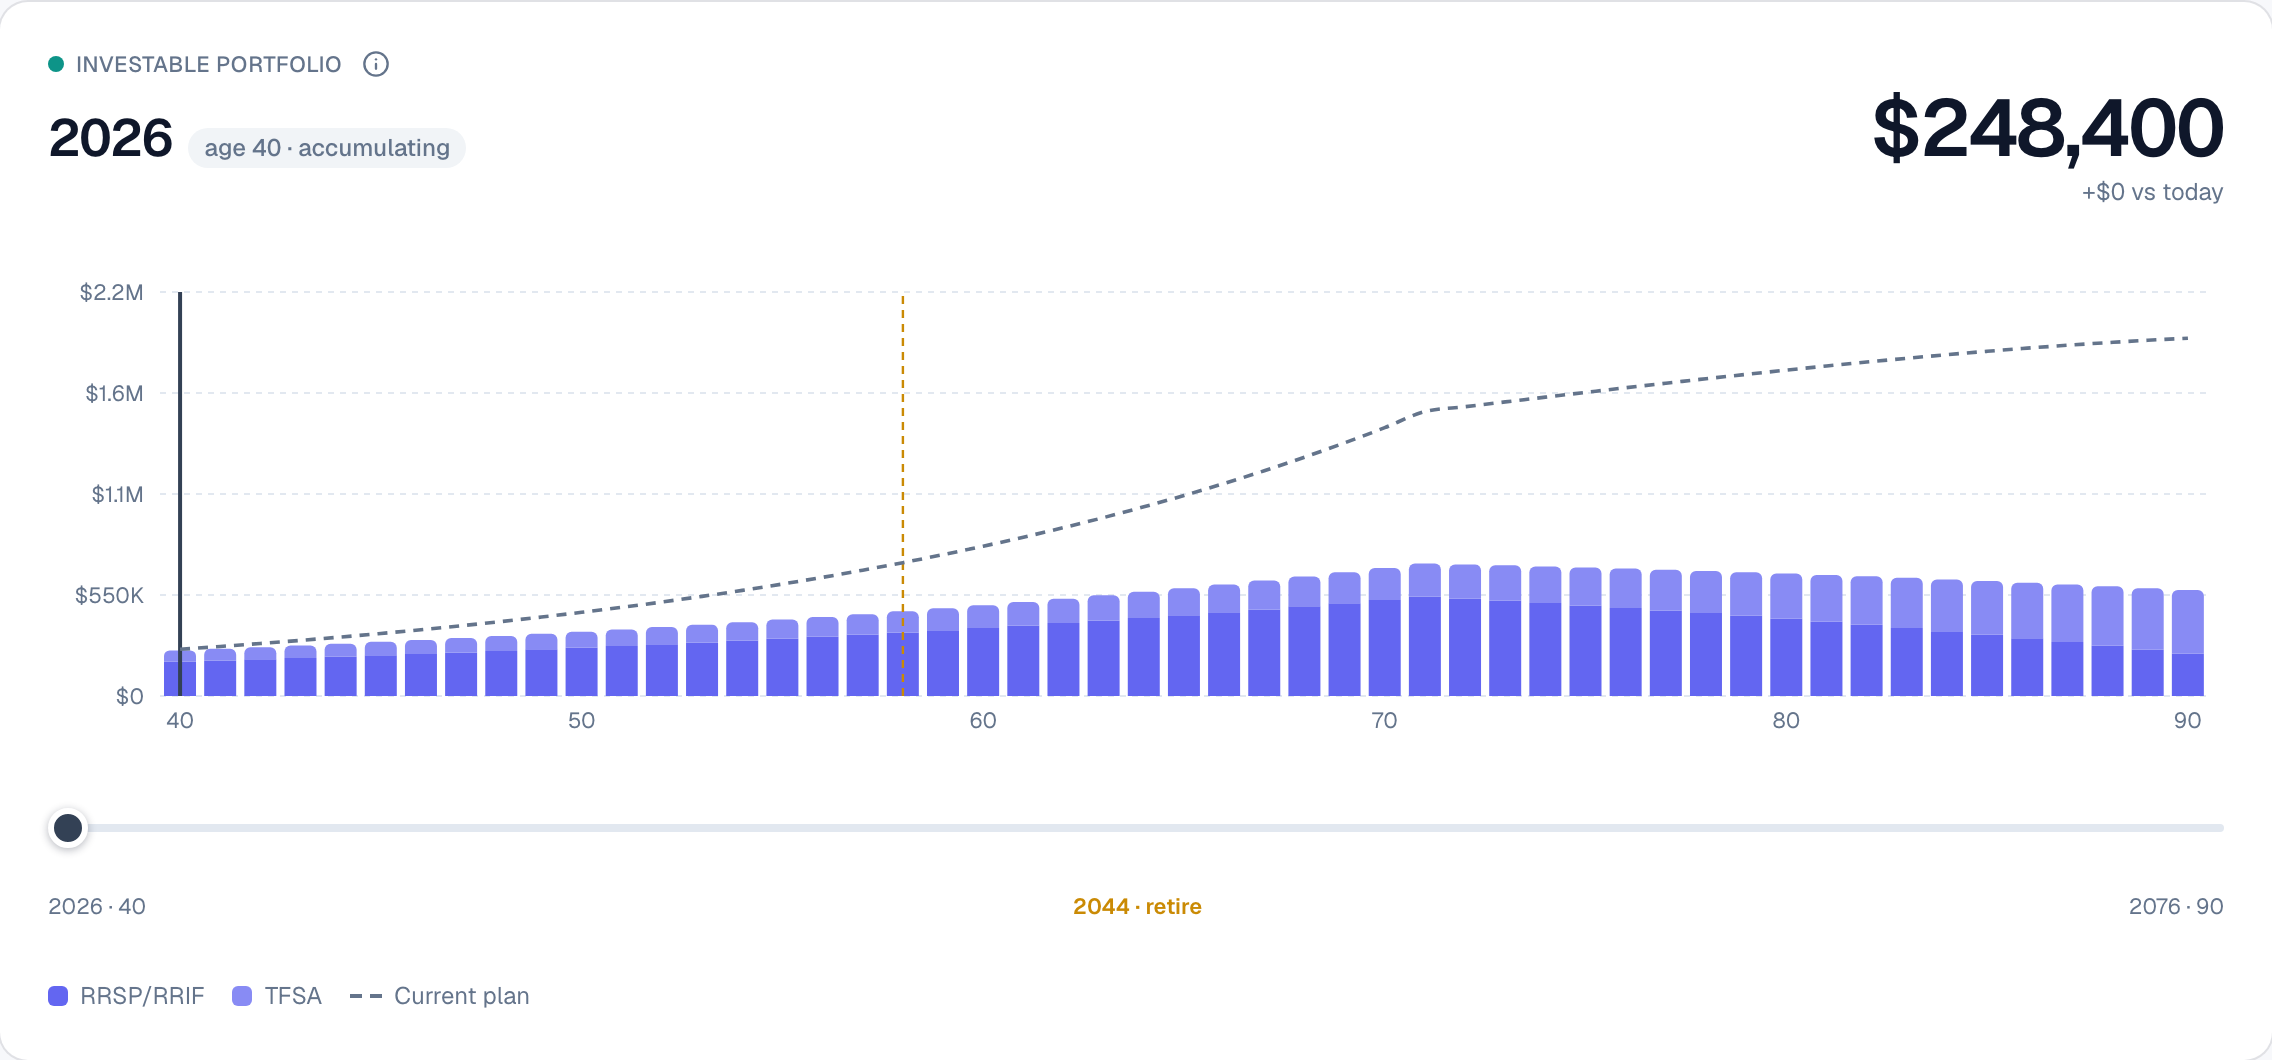
Retire at 58 instead of 65? The scenario bars fall below the dashed current-plan line — the gap is the cost, drawn.
Pull retirement forward to 58 and you can see exactly what it costs: the bars peak lower and sooner, the retirement marker slides to 2044, and the space between your scenario and the dashed plan line is the wealth you'd be trading for those extra years. Underneath, a milestones rail marks the moments that matter — mortgage-free, your portfolio doubling, retirement, and when funds run out or last — and clicking any one jumps the chart straight to that year.
Why it's worth using
- You get the verdict in one second, not after a scroll. The score and its caption are the first thing on the page.
- You can answer your own "what ifs" without leaving the screen. Work longer, save more, spend less — see the effect on every number live.
- What you see is real. Scenarios run through the actual engine, so a hopeful slider can't paper over tax or a depletion the plan would actually hit.
- The trade-offs are visual. The dashed plan overlay turns an abstract "you'd have less" into a gap you can point at.
Retirement planning is most useful when it's a conversation, not a report. Mission Control makes the dashboard the place you have that conversation — ask a question, drag a lever, read the answer, and reset.
Changelog · FEAT-028
- A verdict-first dashboard replaces the previous card-grid body in place at
/dashboard: a readiness-gauge hero, four verdict tiles, an inline what-if lever bar, the lifetime portfolio scrubber with a current-plan baseline overlay, a milestones rail, and a key-metrics strip (src/app/(app)/dashboard/dashboard-content.tsx,src/components/dashboard/{readiness-hero,what-if-bar,portfolio-scrubber,dashboard-milestones}.tsx). - Surface, don't compute. Every figure reads existing projection output — the readiness score (
computeReadinessScore),dashboardMetrics, fund-depletion age, and the per-account composition from ADR-0028 — and the live what-if reuses the existingPOST /api/projectionrecompute (WhatIfOverrides). No new engine, schema, or ADR. - A single scenario state drives the gauge, tiles, chart, milestones, and metrics together, so a lever drag never leaves a stale figure; a dashed current-plan line overlays the scrubber whenever a scenario diverges; an owner filter re-scopes the portfolio by household member.
- Milestone derivation is unit-tested (
deriveDashboardMilestones); the full suite stays green (1,193 tests).