This year, in flow — the cash-flow panel, rebuilt
One screen that shows where your money comes from, what it's committed to, what's left — and where that surplus could go. The cash-flow panel, rebuilt for the way a planner actually reads a year.
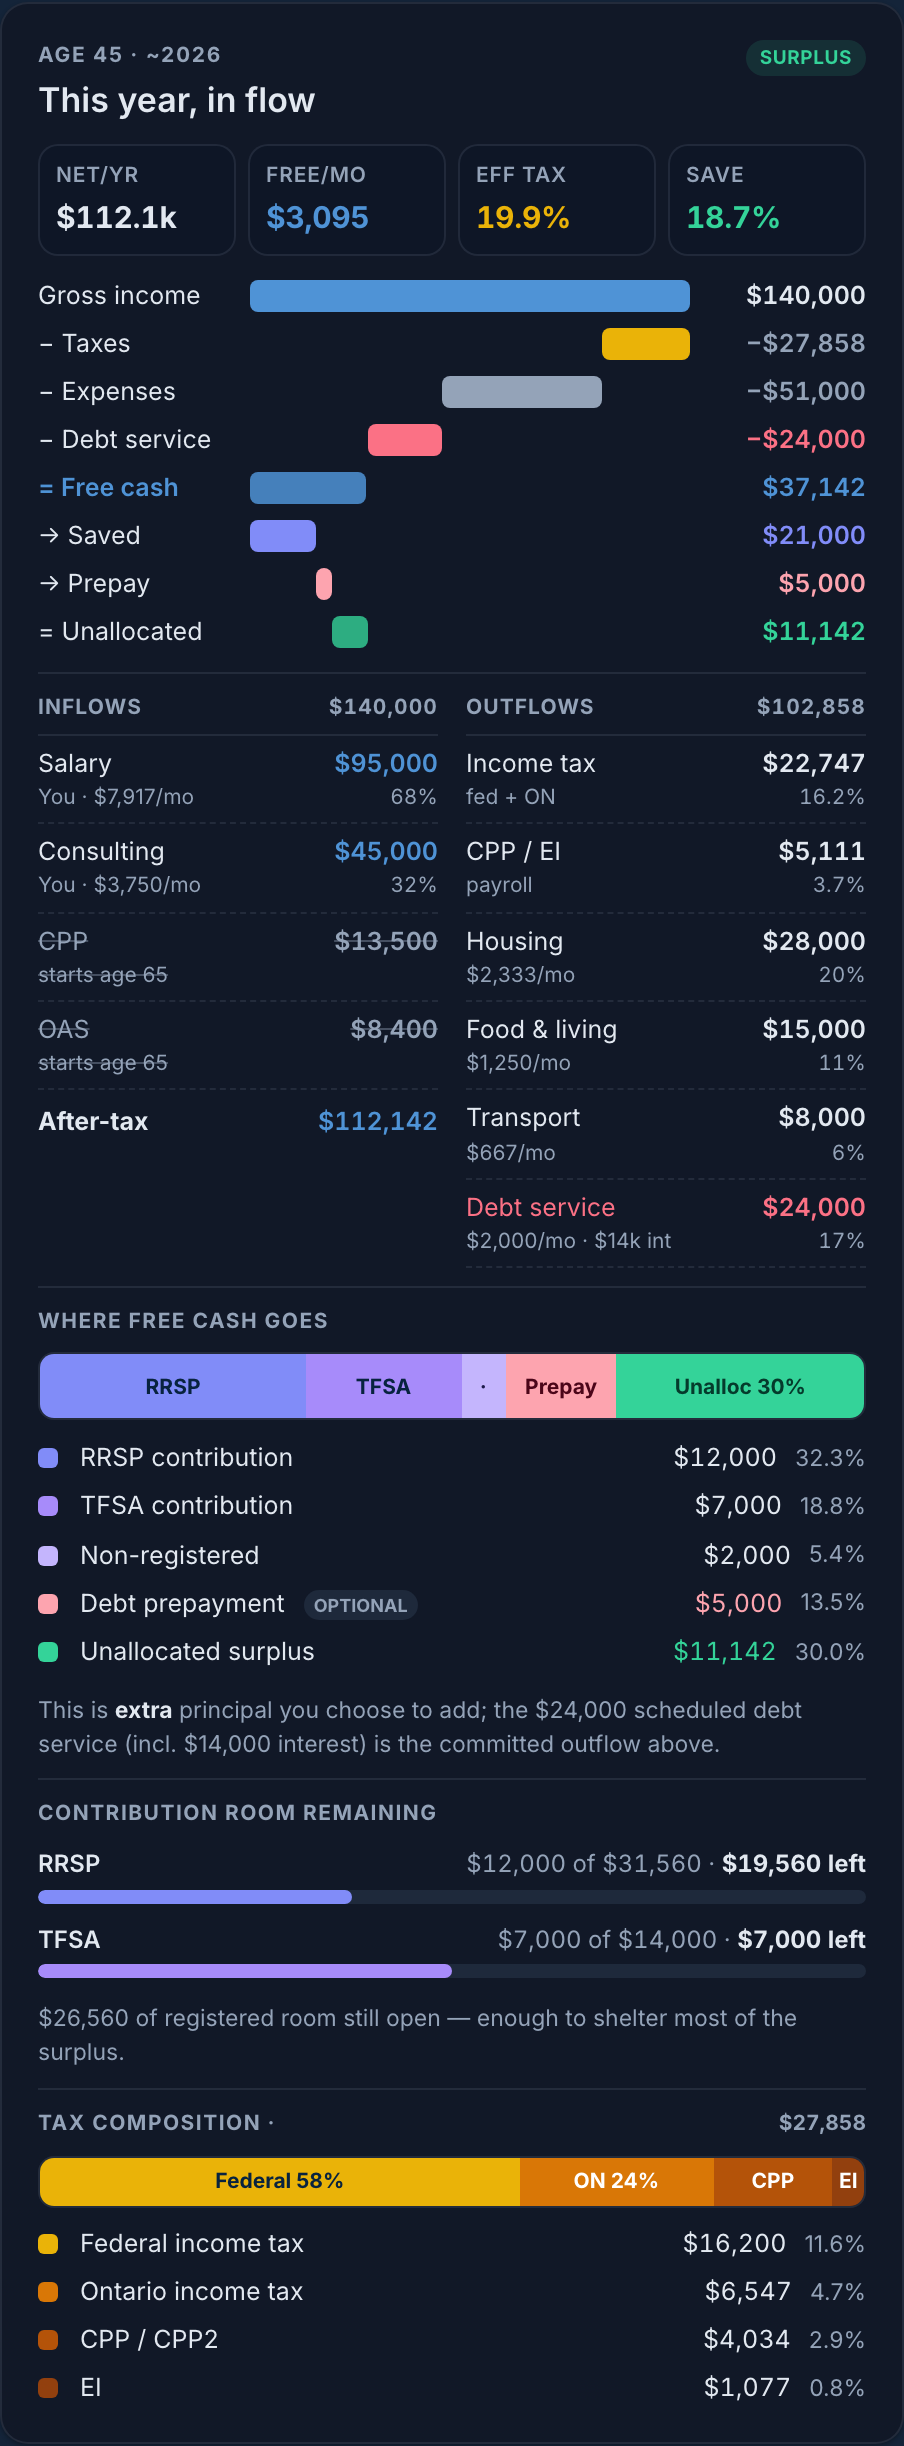
"This year, in flow," for a working-age household at age 45 — the whole year in one column.
The job: see the whole year, decide once
When you sit down to review your money for the year, you have one question underneath all the others: after everything I owe and everything I've committed to, what's actually mine to direct — and where should it go?
The old panel answered the first half. It showed income minus tax minus expenses, told you whether you were in surplus, and tucked the details behind a "view breakdown" link. To answer the second half — how much room is left in your RRSP, what your tax is actually made of, how your mortgage fits — you had to leave the page. So we rebuilt it. Everything that decides your year now lives in one scrollable column, no drill-in.
The story it tells: income meets your needs first; the rest is yours
The spine of the panel is a waterfall. It reads top to bottom like a sentence: your gross income, then each thing that has first claim on it, and finally what survives — your free cash flow — split into where it's going.
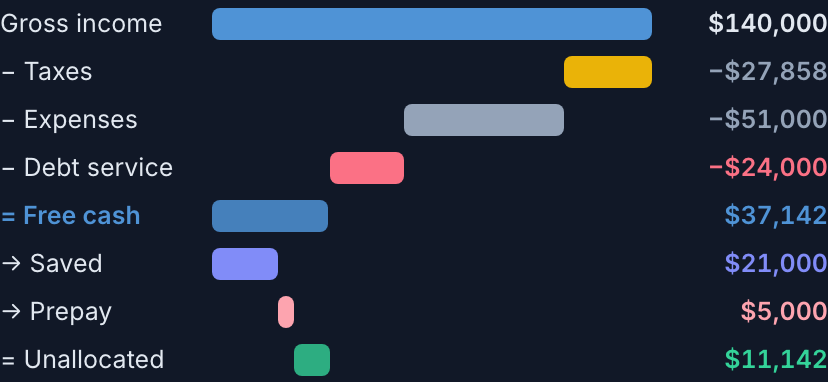
Gross → taxes → expenses → debt service → free cash → saved → prepay → unallocated.
Three things have first claim, and they're shown as deductions before free cash — because they aren't choices you make this month:
- Taxes — income tax plus payroll.
- Expenses — your living costs.
- Debt service — the scheduled payment on your loans and mortgage, principal and interest together.
What's left — free cash flow — is the number the rest of the panel is about. The bar then partitions it into what you're saving, any extra debt prepayment, and the unallocated surplus that's still yours to direct.
How to use it: read it top to bottom
- Glance at the four vitals. After-tax income, free cash per month, your effective tax rate (with marginal alongside), and your savings rate. The health check, in one row.
- Follow the waterfall. See what's committed and what survives. Free cash is the emphasised pivot — everything below explains it.
- Check the receipts. The side-by-side Inflows / Outflows ledger itemises every source and cost, each with a monthly figure and a share — including the debt-service line, so nothing is hidden in "expenses."
- Decide where the surplus goes. The Where free cash goes bar and the contribution room remaining meters turn the number into an action: there's $26,560 of registered room still open — enough to shelter most of the surplus.
- Move the age slider. Every figure re-renders for the selected year. The panel sits beside the lifetime chart, so you watch the bars and the breakdown move together.
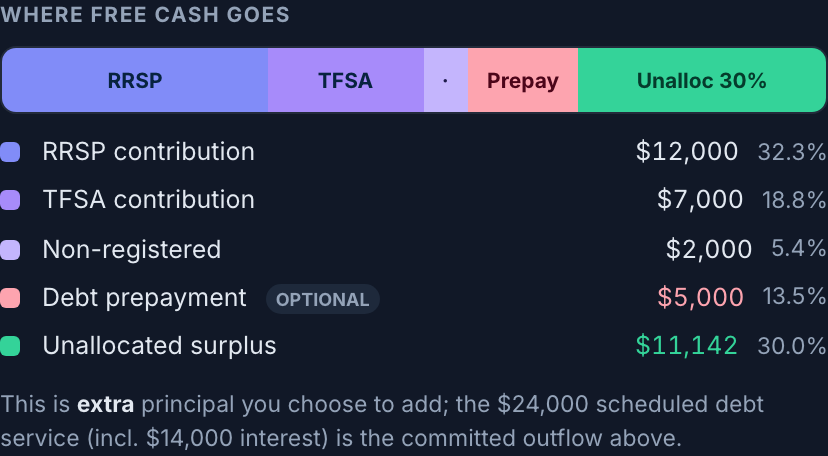
"Where free cash goes" — the discretionary half of the story, prepayment included.
And because the question "why is my tax that big?" always comes next, the tax figure is broken into its parts — federal, provincial, CPP, EI — that sum exactly to what you paid.
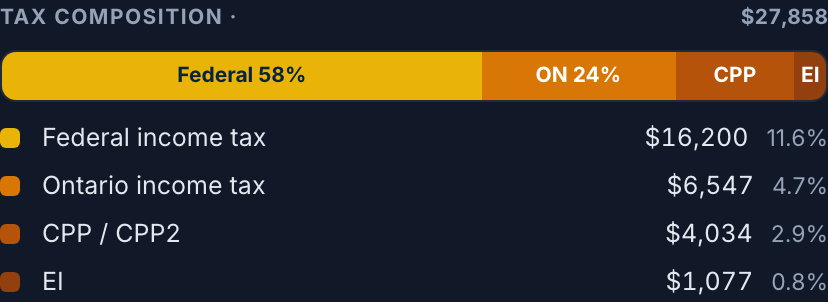
Tax composition — the levers a planner reaches for, made visible.
The intent: why it's built this way
Planner-grade density, not a wall of numbers
We explored five treatments — from a pure statement ledger to a terminal-style dashboard — and landed on this hybrid. A waterfall carries the narrative so a household gets it at a glance; a dense ledger and the planning sections carry the precision so an advisor never has to leave the screen. Story first, density second.
Debt, modelled honestly
The most important decision in this redesign is how debt is treated — and it mirrors how the projection engine already works.
- Committed · debt service — your scheduled payment (principal + interest) is subtracted before free cash: a band in the waterfall and a line in the ledger. It's never folded into "expenses," so your living costs stay clean and comparable.
- Discretionary · prepayment — only extra principal you choose to add from surplus appears in "where free cash goes." It's the one debt decision that's genuinely yours to make this year.
Showing the whole payment as both an expense and a place your surplus goes would count it twice. Splitting committed service from discretionary prepayment is what keeps the waterfall honest.
Every number is real
Nothing on the panel is estimated in the browser. The debt-service split, the tax breakdown, and your remaining contribution room are all computed server-side from the same engine that runs your projection — so the panel and your long-term plan can never disagree.
In retirement, the same panel shifts to a "how this year is funded" view — pensions and portfolio withdrawals against your spending need — in the identical shell, so the page never feels like a different tool before and after you retire.